
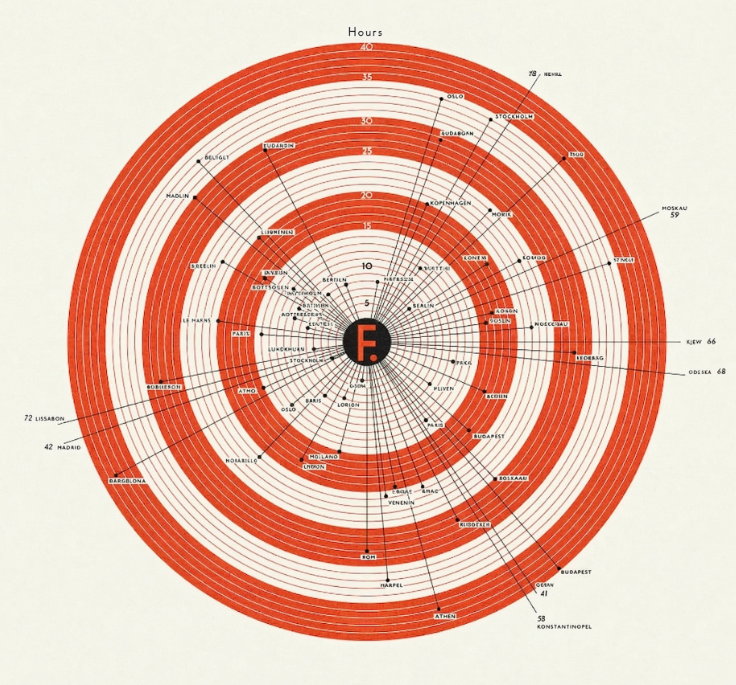
Analytical systems reveal how natural and human processes interact. Complex data becomes intuitive models and maps, turning patterns into clear insights. Maps work because humans interpret them naturally, from navigation to storytelling. This approach uncovers connections and dynamics often missed by traditional analysis.


Guided by curiosity, rigor, and respect for natural systems, our models are both intuitive and creative, making complex interactions between natural processes and human influence immediately understandable.
Models evolve from the patterns in the data rather than forcing it into predefined structures.

Ongoing work leverages modern GIS software and cloud-based platforms, including Google Cloud Services, to securely store and manage complex datasets. Interactive web applications are built through the ESRI ArcGIS platform, allowing users to explore patterns, trends, and relationships directly. All analytical processes follow professional standards, supported by CompTIA Data+ certification to ensure data integrity and quality.